
Meesho Payment Report Analyzer Tool
Upload your Meesho payment Excel report (.xlsx, .xls) to view your sales, bank settlements, return deductions, advertising costs, and SKU profit in one place.
Drag & Drop your Meesho Excel Workbook Here
Or click to upload from your local drive (.xlsx, .xls)
Analyzing workbook structure...
Overall Health Diagnostics
Revenue by SKU (₹)
Net Profit by SKU (₹)
Settlement Share by SKU (₹)
Daily Payout Trend (₹)
Settlement Breakdown & Adjustments
| Accounting Component | Transaction Rows | Sum Amount (₹) | Description |
|---|
Returns vs RTO Volumetric Split
Return & RTO Volumetrics by SKU
0
0
0
0
0.0%
0.0%
- No data
- No data
- No data
- No data
SKU Wise Returns & RTO Rates
| SKU | Shipped | Delivered | Customer Return | RTO | Return % | RTO % |
|---|
₹0.00
0.0%
Reverse Shipping Charges by SKU (₹)
Reverse Shipping Loss Leaderboard by SKU
| SKU ID | Product Title | Returned Units | Reverse Shipping Cost (₹) | % of Total Reverse Charges |
|---|
Reverse Shipping Loss by Catalog
| Catalog ID | Returned Units | Reverse Shipping Cost (₹) | % of Total Reverse Charges |
|---|
₹0.00
0.0%
0.0x
₹0.00
₹0.00
₹0.00
Top Costly Campaigns
| Campaign ID | GST Deducted (₹) | Campaign Net Cost (₹) | Total Ads Cost (₹) | % of Total Ads Spend |
|---|
Daily Ad Spend Ledger
| Deduction Date | Deduction Duration | Campaign ID | Base Ad Cost (₹) | GST (₹) | Total Ads Cost (₹) |
|---|
| SKU | Orders | Sales | Settled | COGS Sourcing (₹) | Attributed Ads (₹) | Net Profit | Margin |
|---|
Catalog: -
Catalog: -
Catalog Health Slabs (Real Calculations)
| Catalog ID | Sales (₹) | Profit (₹) | Return % | RTO % | Rev. Ship (₹) | Health Score | Status |
|---|
| Order Date | Sub Order ID | Supplier SKU | Sales (₹) | Settle (₹) | Forward Ship (₹) | Rev Ship (₹) | Profit (₹) | Status |
|---|
Sourcing values are automatically saved in local browser memory and are used to compute margins. Set a bulk pricing rule below or modify individually.
Upload an Excel sheet (.xlsx, .xls) containing columns: SKU | Cost Price to automatically match and update sourcing values in browser memory.
Define Sourcing Costs by SKU
| SKU Code | Avg Sales Payout | Unit Sourcing Cost (₹) |
|---|
Upload two different Meesho payment spreadsheets (e.g., previous month vs. current month) to check growth trends, return rate changes, and ad spend efficiency.
Drag Excel sheet here or click
Drag Excel sheet here or click
Growth & Variance Statistics
| Metric Name | Report A | Report B | Variance | Growth % |
|---|
Report A vs Report B Metrics Comparison
| Rank | Supplier SKU | Value |
|---|
How to Download Your Meesho Payment Report
Follow these steps to download your Meesho payment report and upload it to the analyzer.
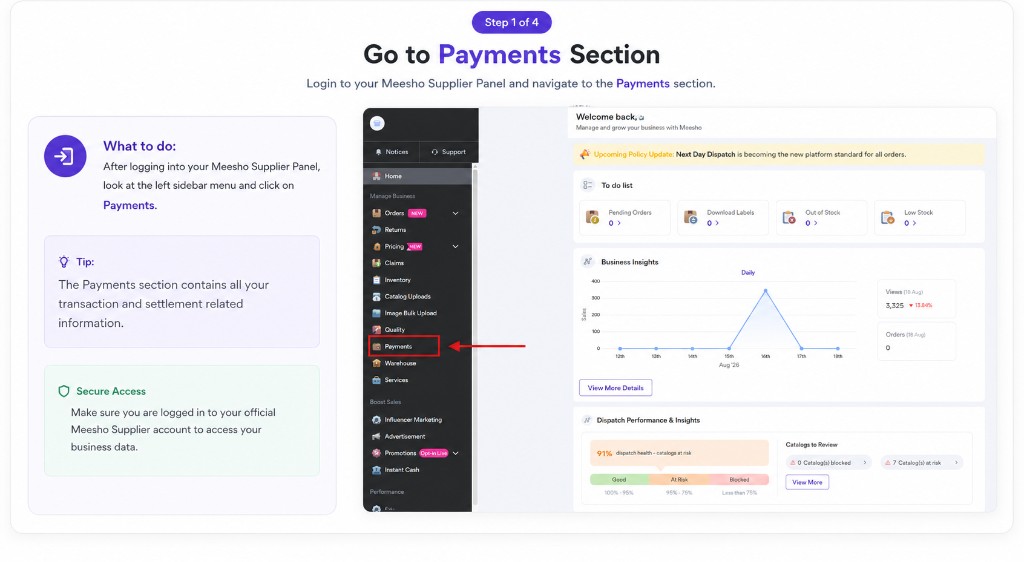
Go to the Payments Section
Log in to your Meesho Supplier Panel and open the Payments section from the left sidebar.
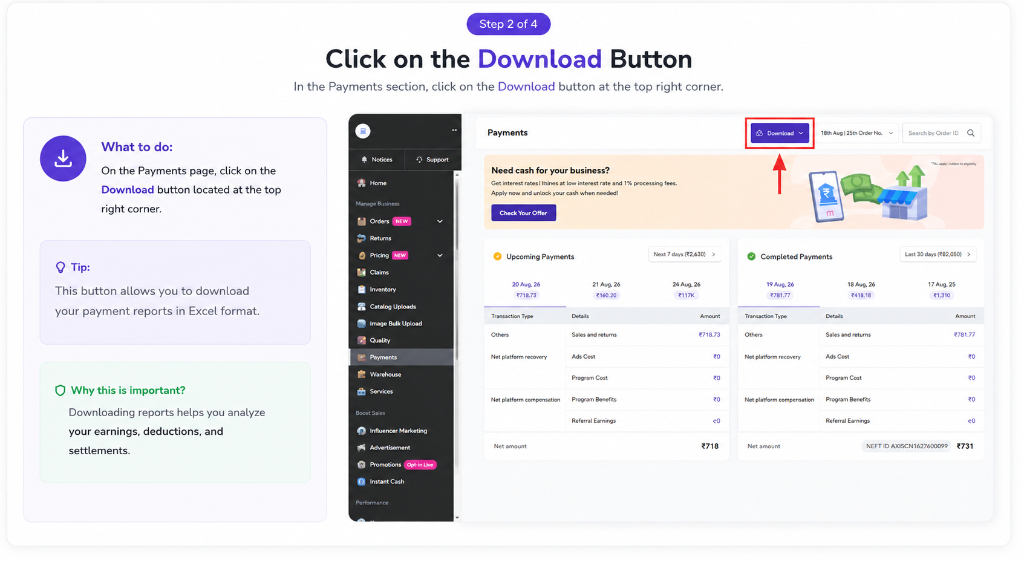
Click the Download Button
On the Payments page, click the Download button at the top right.
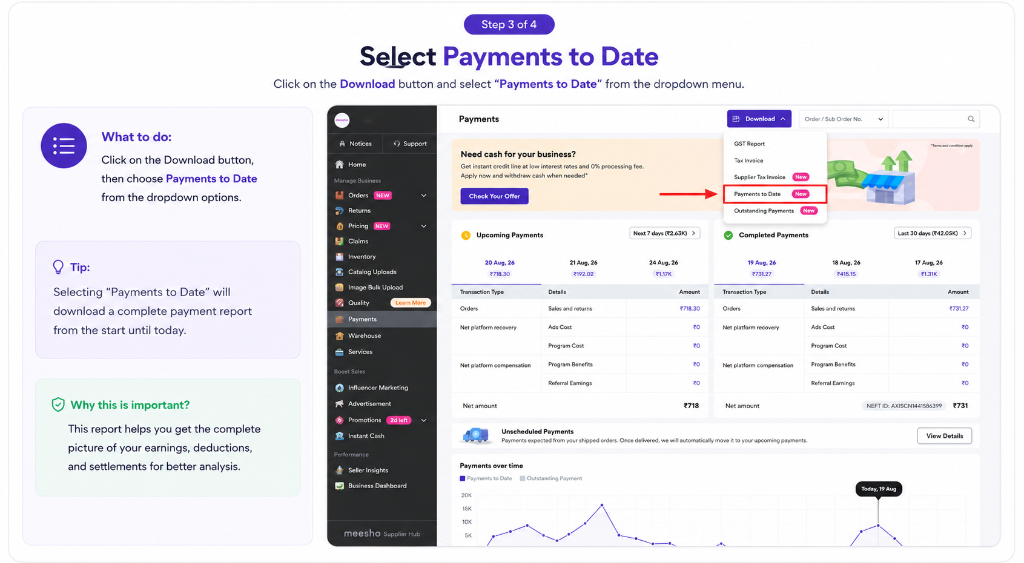
Select Payments to Date
Open the Download menu and select Payments to Date.
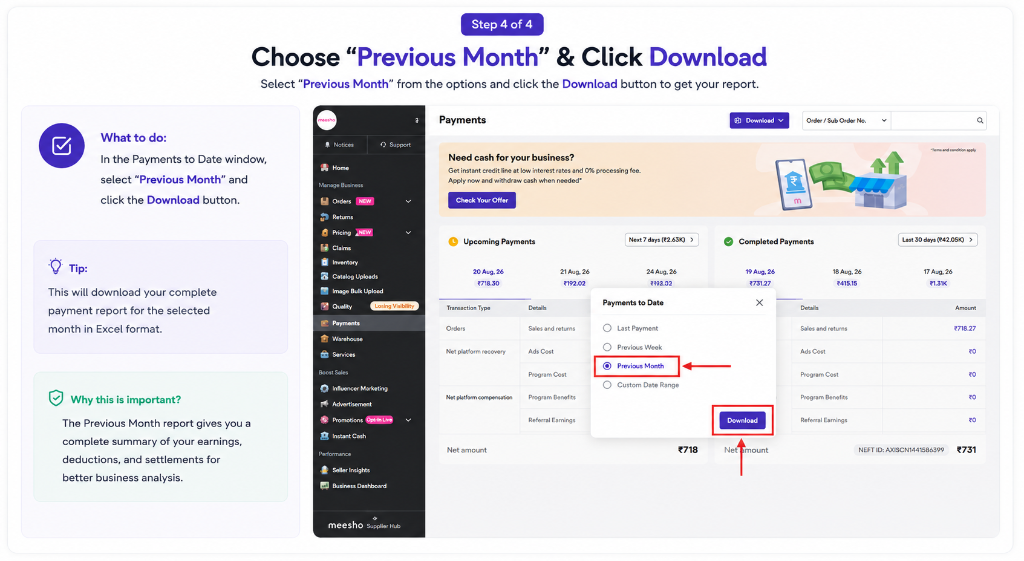
Choose Previous Month & Download
In the Payments to Date window, select Previous Month or Custom Date Range and click Download.
Upload Your Meesho Payment Report
Upload the downloaded .xlsx or .xls file in the upload area above using the Select File button or drag-and-drop area.
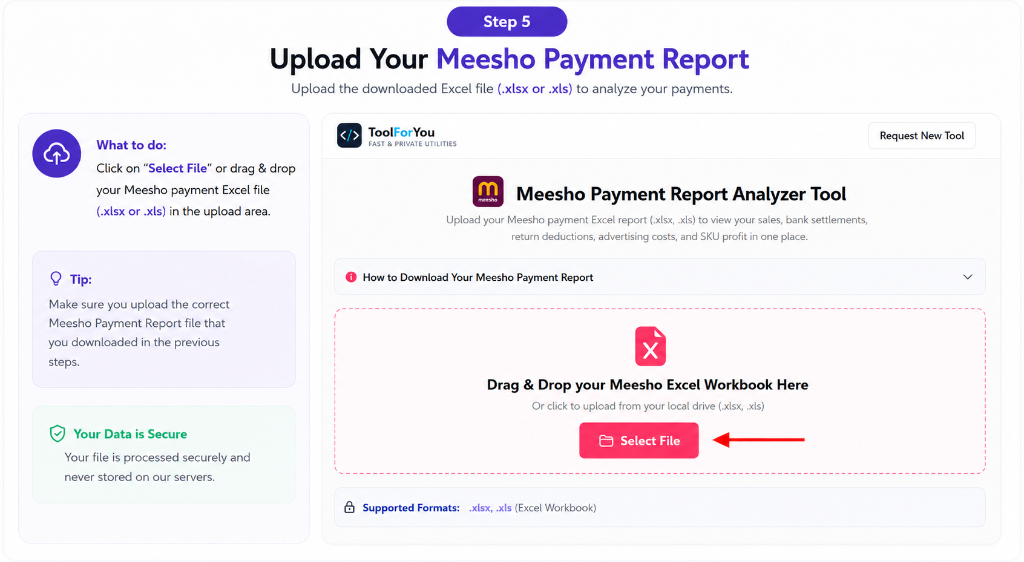
Once the Excel report is downloaded, upload it in the upload area above to analyze your Meesho payments, settlements, deductions, returns, advertising costs, and product-level results.
Understanding Your Meesho Settlement & Deductions
When Meesho deposits money into your bank account, the final amount is rarely the same as your total sales volume. Every payout spreadsheet includes multiple deductions that explain the difference between customer order values and actual bank deposits.
Meesho Payment Report Analyzer Tool processes your completed payment workbook and organizes the raw numbers into a clear financial overview. It breaks down your forward courier expenses, advertising wallet debits, return deductions, and statutory tax withholdings like TDS (Section 194-O) and TCS so you can see where every rupee went.
All calculations occur locally inside your browser. Your spreadsheets and sales numbers are never uploaded to any remote server.
Where Revenue Is Lost: Customer Returns vs RTO Penalties
One of the biggest leaks in online selling is return handling. In your Meesho payment report, returns are split into two distinct categories that affect your bottom line differently:
- RTO (Return to Origin): When a parcel is undelivered—such as a rejected cash-on-delivery order or incorrect address—the product returns to your inventory. On Meesho, RTO orders generally do not incur return shipping penalties.
- Customer Returns: When a customer receives the item and later requests a return, you face both lost revenue and reverse logistics deductions. Tracking this metric helps you identify flawed listings or sizing issues before they cause heavy losses.
Calculating True Product Profit with Sourcing Costs (COGS)
A product with high sales volume is not necessarily profitable. If advertising fees and return courier penalties exceed your markup, you might be losing money on every unit dispatched.
Under the COGS tab, you can enter your product purchase or manufacturing cost for each SKU. The analyzer combines your product cost with the actual settlement numbers, return deductions, and ad spend from your report to calculate your exact net profit and profit margin percentage per product.
Comparing Two Payment Periods to Spot Margin Trends
E-commerce performance shifts over time. Seasonal campaigns, price changes, or courier adjustments can alter your profitability from one payout cycle to the next.
Using the Compare Reports tab, you can upload spreadsheets from two different months or payment cycles. The tool displays side-by-side comparisons of gross revenue, return rates, advertising spend, and net bank payouts to show whether your profit margins are expanding or shrinking.